- Published on
IdlinKing
- Authors
- Name
- Han Ling Tung


Project Description
IdlinKing is a mobile app that aims to help users reduce car idling time in King County.
During the 11-week design thinking course at the University of Washington, my team focused on the problem of reducing greenhouse gas emissions from car idling when waiting at the traffic light. The project went through 5 main stages.
- Secondary Research
- Field Research
- Survey
- Design Goals/Requirements Generation
- Initial Prototype and Usability Testing
Our team followed the design thinking process that is introduced in this course.


Design Question
How can we effectively inform people of the incoming traffic along with traffic light information to reduce car idling time and its Greenhouse Gas emissions when waiting for traffic lights to all personal vehicles in King County to create a low-carbon future?
Our Team
Our team consists of three members, Felix Chen, Yunhan Yu, and myself.
Our Solution
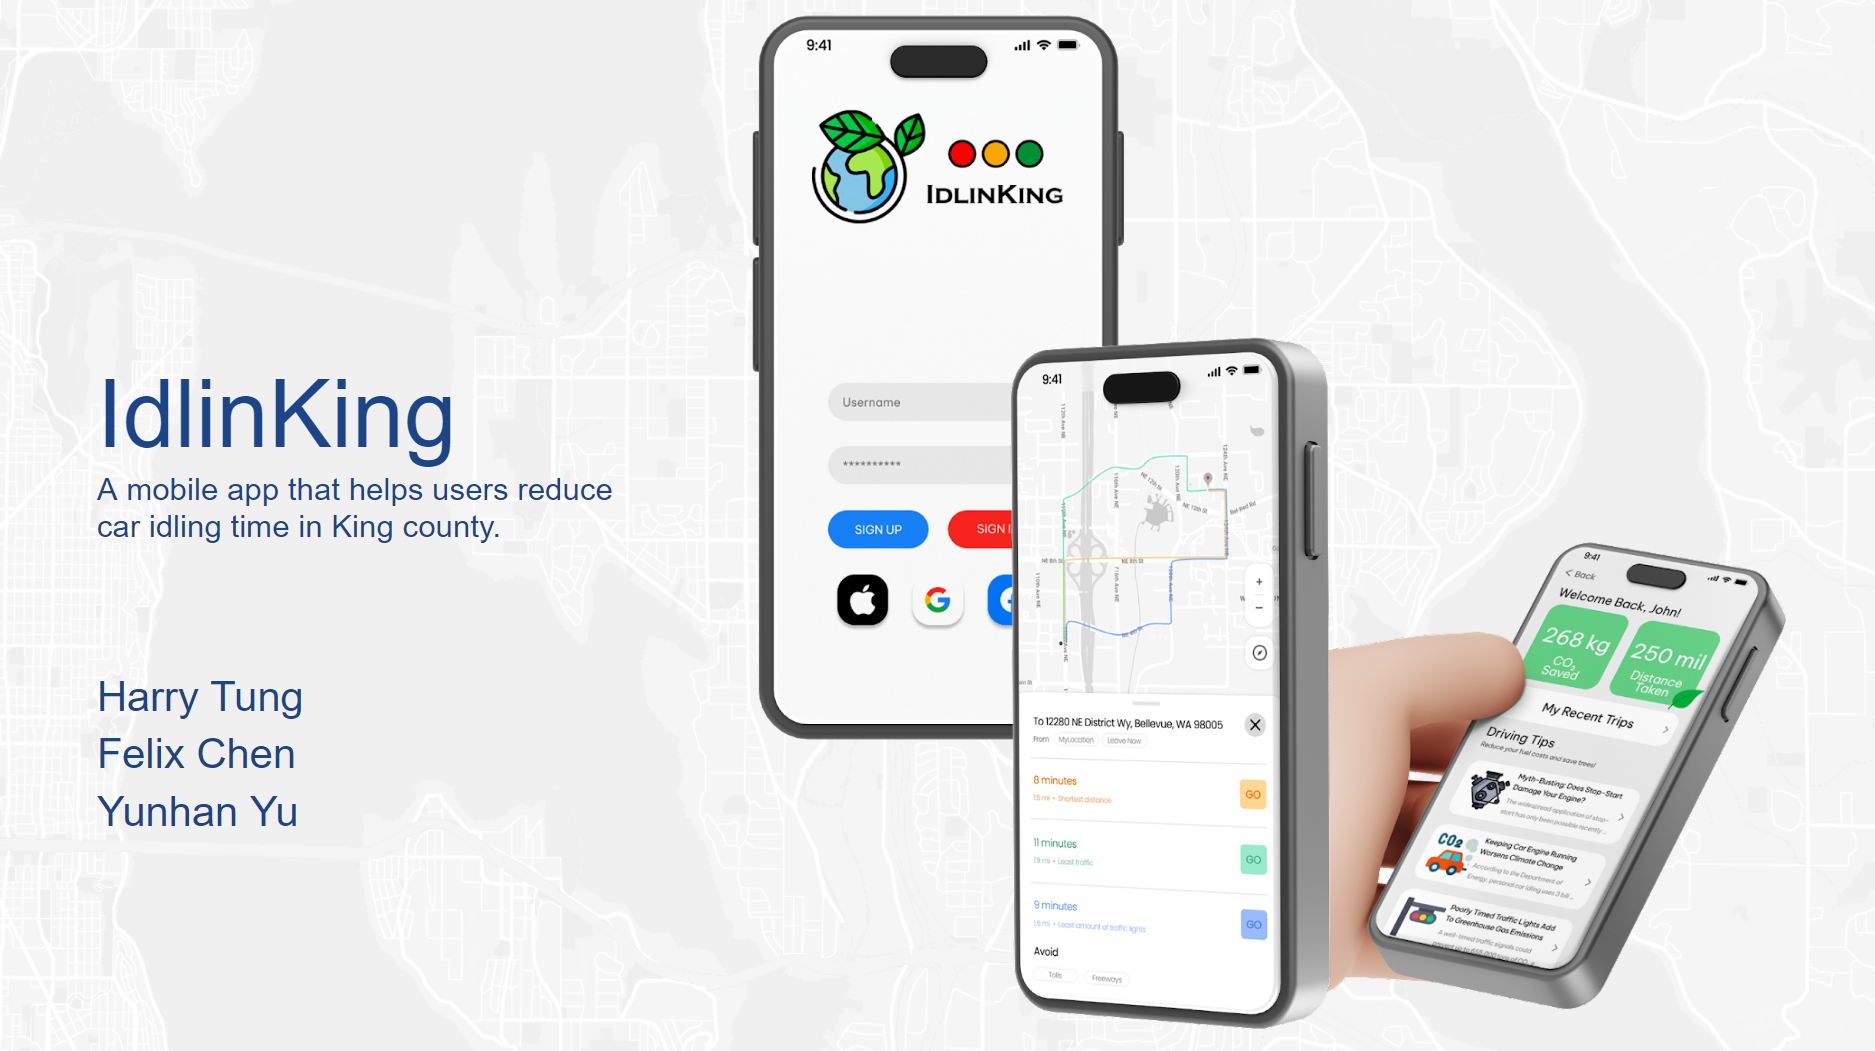
IdlinKing, an app that provides street navigation with consideration in car idling times
Our app aims to assist King County drivers with planning better routes and developing greener driving habits. Primarily, we aim to reduce controllable car idling time at traffic lights, parking lots, and other places. We also provide tips to avoid car idling and visual effects that subtly educate drivers on how much they've contributed to saving the planet by limiting their Greenhouse gas emissions from driving.


Design Process
Initially, we are presented with the topic of low carbon future and are asked to investigate the current impact of greenhouse gas emissions. This led us to do some secondary research to try to find out the scope of the problem.
Secondary Research
In our secondary research, we used online sources such as new articles, research papers, and government information websites to help us find the scope of the problem and the current solutions.
According to the article from the U.S. Department of Energy, there are more than 30 million tons of CO2 generated annually just by personal vehicles idling. Looking at King County specifically, we found out that in 2019, transportation contributes to 43% of the total greenhouse gas emissions produced.


King County Communitywide Geographic Greenhouse Gas Emissions
From these reports, we decided to take a deeper dive into the root cause of the problem and see if there is any issue that may be overlooked. This is where we found a research article by INRIX about intersection analytics. According to their report, optimizing traffic flow could decrease up to 20% of vehicle emissions and also improve safety.
Reflection
From the secondary research, we learned a lot about the current vehicle emission situation in King County. We were surprised at how big the impact is with cars idling because most modern cars have auto-start features already built in. To further investigate the issue, we decided to do some field research and study people's behaviors when waiting for the traffic light.
Field Research
Thanks to the secondary research that we did, we were able to adjust the design question so that we could target a more specific set of users. For this field study, we are targeting personal vehicles specifically within the King County area. Narrowing the target users helped us to identify and focus on the key elements that we are observing in the field studies. Before our field studies, we identified six areas of focus that we wanted to learn more about. These areas include Built Environment, Tools and Technology, Demographics, Traffic, Information and Communication Access, and Overall Experience.
We conducted three field studies (each member did one study) that are located at three different intersections in King County. Based on the feedback from the instructor, we chose the same time frame for all three observations so that it would be consistent. In each location, we sat down for 30 minutes and took notes of the cars passing through. We made observations based on the focal points we identified beforehand so that we could focus on what we wanted to look at.


After combining all three studies, we were able to summarize what we found into 5 main points.
- Most people are driving their cars with auto-start disabled.
- Most people are driving alone or with another person.
- Most people do nothing when waiting for the traffic light.
- All three intersections do not have signs that encourage people to turn off their engines when waiting for the red light.
- All three intersections have different wait times to accommodate different traffic.
Reflection
From the field research, we learned a lot about users' behavior when waiting for the traffic light. I believe doing this field research is important because it can provide us with potential reasons why traffic lights can contribute to vehicle emissions. Without doing the field research, we would never be able to come up with the 5 main points by just doing the secondary research because those research only provided us statistics (What?) but not the process (How?).
Survey
Based on the secondary research and field study, we found that most people do not turn off the engine when waiting for the traffic light. To figure out the reason behind this behavior, we decided to conduct some surveys and gather more data using Google Forms.
As of current writing, we managed to obtain 41 responses which can be viewed at Google Sheets here.


Based on the survey results, we came up with 4 overall insights that we thought it is important for us to consider when coming up with a list of requirements for our solution at the next stage of the design process.
- Auto-start function cannot fully solve the idling problem since some cars do not have that function. Although cars have that function, drivers may not use them because it is annoying and unsure about fuel consumption.
- Drivers will encounter more than 5 traffic lights when driving to a destination. And most of them do nothing while waiting for traffic lights.
- Maps and navigation are always used while driving to a destination.
- Drivers let the car idle while waiting for the traffic light since unsure of when the green will be green.
From the survey, we were able to confirm our suspicion that the built-in auto-start function does little help in reducing vehicle emissions because almost half of the participants were not using it while driving.
Reflection
Looking back at our survey, we hoped that we could have more time to conduct more surveys so that we can cover a broader audience. As we only have a week to conduct our survey, we could not obtain as many responses as we have hoped to obtain. However, we believe that the survey truly helped our team to identify the needs and wants of our target audience. All these studies are equally important as we are narrowing down the scope of our design question and creating a more effective solution.
Design Goals/Requirements Generation
After gathering all the data obtained from the studies we did, we began to create a list of requirements that our solution will need to have. We started by performing affinity analyses to show the relationship between each observation from our field notes.


Based on the data we obtained, we identified our stakeholders and system components that will be affected by our solution.


Main stakeholder
All the drivers in King county. We aim to design a smart system that provides live information on incoming traffic, and safe but efficient ways to avoid idling time specifically when waiting for traffic lights.
Secondary stakeholders
City Planning Department and Environmental Protection Department. We believe that the data generated by the system we aim to design can help the city plan routes and traffic lights even better.
Other stakeholders
Car manufacturers can see why drivers choose to turn off the auto-start function in their cars so that they can improve that mechanism.
From this, we created the 4 design goals that we wanted to solve with our app.
- Most Suitable Routes: We wanted to provide users with suitable routes that can both save time and reduce vehicle emissions.
- Red Light Time Reminder: We wanted to provide a countdown for the red light so that users can decide whether turning off their car engines is worth it or not.
- Reward System: We wanted to provide a reward system such as coupons or promotions from local stores in King County that is based on how much carbon footprint is reduced. This is a way to incentivize users to keep using our app.
- Education on Greenhouse Gas Emissions and Myths: We wanted to provide a place for users to obtain accurate information about the auto-start function in their cars.
With these design goals in mind, we then proceed to create a couple of sketches that helped us to identify the core tasks that we wanted to prototype and test.


Reflection
When we are coming up with the requirements, we were glad that we had plenty of data to work on and that every goal we came up with can be supported by our research. All those research helped us quickly generate our requirements. The sketches we drew also helped us to visualize what kind of features are beneficial to our users. Providing that we only have a week to create our prototype, the sketches helped us to identify the core features that we wanted to implement and test during the usability tests.
Initial Prototype and Usability Testing
From our scenario sketches, we came up with 6 core tasks that we wanted to demonstrate during our usability testing.
- Generate routes with different filters from one place to another.
- Notify users of the duration of the red light.
- Provide more information about upcoming traffic.
- Calculate how much gas will users be saving and how much greenhouse gas emissions are reduced after reducing idling time.
- Educate users about the auto-start function and whether it would hurt the engine or not.
- Motivate users to turn off the engine.
Having those core tasks in mind, we created our basic app UI using Figma. For the usability testing, we wanted to understand how easy it is for users to understand the functionalities and UI elements in the app. By creating an app that is both effective and easy to use, we hope to bring more users to use the app so that we can reduce greenhouse gas emissions more effectively.
The test's purpose is to evaluate the user interface design of the app. We hope to gain an understanding of user expectations, difficulties, and recommendations as to how to improve the application for future iterations.
Our main method of testing is simply observing the participants and taking notes along the way. By letting participants try the app without our interference, we would have a clear idea of whether the flow and UI design of the app is straightforward for first-time users.
After participants finished navigating through the app. We then asked them several additional questions that we were not able to answer by observing. We went through the app again from start to finish pages and asked them about the flow and how they feel about the UI design. Finally, we end our testing session by asking them about the idea and any additional features they might want so that they are more willing to use the app in their daily lives.
We tested our prototype by inviting four UW MSTI graduate students. These participants are suitable for this study because they fit our target audience. MSTI students are very diverse so we can test our prototype with people having different cultural backgrounds.


From the usability testing, we received valuable feedback from our four participants. Overall, most of the participants were amazed at our UI design and program flow and they also suggested some small UI tweaks that could make our app easier to navigate.


We were able to summarize all the feedback into 5 key findings.
- The Colors and differences of each route are confusing for a new user.
- Lack of the countdown and turn-off engine hint during a red light.
- Confusing or not clear with the size, shape, or color with some icons.
- The interaction of the prototype does not fulfill the requirements of navigation.
- Current functions can partly fulfill the requirements of the users. To make it easier to use, add other functions like audio, preference setting, and intuitive data.
From these findings, we can revise our design and make it more intuitive for the user.
Reflection
Although our team spent a handful amount of time creating the UI and the flow of the app so that the app is as intuitive as possible to the users, there are still a lot of things that we overlooked. This tells us the importance of product testing before deployment. Having a background in software development, we always go through multiple rounds of testing before releasing an update or a feature to the public. Even though the changes might be small and simple at the first glance, there are always some issues that you will never discover until you test them.
Conclusion
Looking back at this project, I think I learned a lot about the design thinking process. Agreeing with our instructor Sarah, I also believed that the term Design Thinking has been misused a lot and caused a lot of confusion. I think design thinking is a framework for you to crack a broad and vague topic into smaller scopes to find the core problem that you want to solve.


In my undergraduate studies as an electrical engineer, the problems we are being presented are usually very obvious and we can just use a specific set of tools to solve them. However, in real-world scenarios, this is not often to be the case. In some cases, the problem is very broad and you will not able to find a suitable solution without doing any research.
Just like Sarah suggested, the design thinking framework is simply just a tool for you to identify problems. On the other hand, engineering approaches such as agile methodology is also a tool but is best for solving well-defined problems. As an engineer, we always said that we need to use the right tools at the right time. Both tools are extremely powerful at solving problems that they are good at, but not as much when you use them in the wrong situation.
Finally, I would like to thank our instructor Sarah Zuberec for sharing her take on the design thinking framework and helping our team throughout the project. Her unique experience working at Microsoft and Amazon gave us a good perspective on program and product management in real-world scenarios. I also would like to thank my team member, Felix Chen and Yunhan Yu, for providing their insightful knowledge throughout the project. I sincerely believed that the project will not be a success without their support and I am looking forward to working with them together more in the future!